Charting the history of western art with math
For more than a century, researchers have used statistics to study writing style in a sort of literary forensics technique called stylometry. In 1901, physicist T. C. Mendenhall famously measured word-length frequency in William Shakespeare’s works and reported that the writer’s style was awfully close to that of fellow writer Christopher Marlowe, fueling rumors that the latter may have written works attributed to the former. The techniques are still in use: In 2013, stylometric software unmasked “Robert Galbraith,” author of the acclaimed crime fiction novel The Cuckoo’s Calling, as J. K. Rowling, who penned the Harry Potter books.
Stylometry reaches other arts, too. Computer scientists have unleashed algorithms on paintings, charting mathematical patterns in the artwork of masters like Jackson Pollack, Vincent van Gogh, Pieter Bruegel the Elder, and others (1⇓–3).
More recently a trio of Korean physicists undertook a massive project to quantify changes in the use of color and contrast in the history of Western art. Daniel Kim and Hawoong Jeong at the Korea Advanced Institute of Science and Technology in Daejeon, and Seung-Woo Son at Hanyang University in Ansan, analyzed the digital versions of 8,798 paintings from the Web Gallery of Art, an online database of European art created and maintained by a physicist and computer scientist in Budapest. Focusing on color use, color variety, and contrast, the physicists reported that over the last millennium or so, Western art has become brighter and has used more colors (4).
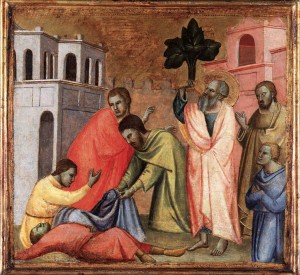
To study contrast, the physicists used color data from a painting’s digital file to quantify the brightness of each pixel. The researchers translated that quantity into a height, creating a column on each pixel at the same position so that brighter spots stood taller than darker spots along the z axis. This technique effectively turned flat images into a sort of deep-pile carpet. (An example of the technique is shown in the images of St. John the Evangelist Drinking from the Poisoned Cup.)
Read the entire article, published in PNAS, here.